Brief Two »
Role of Transportation in Addressing Barriers to Economic Opportunity
Background
Low-income workers in the Bay Area face multiple barriers to career advancement. We found that the economic and workforce development fields often overlook a key barrier: transit access. In turn, transit advocates often overlook the importance of job creation and training to building a stronger Bay Area economy as well as asset building. Moving to Work examines the critical role of transit – as well as development clustered around transit (“TOD”) – in linking low-income communities with career-ladder opportunities.
Findings from the Moving to Work project are summarized in four research briefs. Following the discussion in Brief One of Barriers to Quality Jobs Faced by Low-Income Workers, Brief 2 explores more deeply the details of how transportation barriers affect economic opportunity for low-income workers. Brief Three focuses on improving access for low-income workers to career-ladder jobs by identifying “Industries of Opportunity.”
Brief One identified the cost of transportation as a significant barrier to low-income workers. The average low-income household in the Bay Area spends 24% of its income on transportation costs, compared with a national average of 18%. For low-income Bay Area households that have a car, the cost of owning and operating a vehicle is often the second greatest household expense after housing costs. Although 84% of Bay Area low-income households do own a car, some may not be able to afford to drive regularly, or must cut other essential expenses in order to pay for gas and repairs. For the 16% of low-income households that do not own a car, the size of the region and sprawling location of many jobs make it difficult and expensive to depend on transit.
To evaluate the transportation access challenges facing low-income workers, this paper considers geographic factors in its analysis of how low-income workers are connected to jobs, including:
- The location of residents, jobs, and services;
- The population density of neighborhoods, job centers, or services, and whether densities can generate high use of transportation systems; and
- The active hours of neighborhoods, job centers, or services relative to operating hours of transit.
Transit Access of Low-Income Residents
As discussed in Brief One, low-income residents are scattered throughout the Bay Area, but there are some neighborhoods where transit-dependent, low-income residents are concentrated. These areas of concentration, defined by the Metropolitan Transportation Commission as Communities of Concern, are home to approximately 40% of all low-income residents in the Bay Area. Because of the concentration of transit-dependent residents in Communities of Concern, these areas could be prioritized for future transit investments as a way to ensure that the transit system is serving residents and workers who are more likely to be transit-dependent. However, the fact that 60% of low-income residents do not live in these areas underscores the fact that the region will face an ongoing challenge in offering transportation choices to all low-income residents as a way of reducing the combined cost of housing and transportation.

Figure 1: Transit Frequency and Communities of Concern
Understanding where low-income workers live and the location of jobs they are qualified to fill can provide information on how to improve access to jobs, especially via transit. Figure 1 shows the frequency of transit relative to the Communities of Concern (outlined in purple). “Quality transit” service is typically defined as bus or rail service operating every 15 minutes or more at rush hour (also known as a 15-minute “headway”). The dark green areas show neighborhoods within a half-mile of bus or rail service that comes at least every 5 minutes during peak commuting hours. Light green frequency is 6-10 minutes, yellow is 11-15 minutes, and brown is 16-30 minutes. The highest frequencies occur in the densest areas of the Bay Area: the downtown areas of San Francisco, Oakland, and San Jose, as well as various other downtown areas and transportation hubs.
"There is still a heavy daily migration of residents going to the inner core of the Bay Area for jobs."
-Randy Tillery, Contra Costa Community College District
Frequency is a rough measure of how well each neighborhood is connected to transit, but much of the transit access of neighborhoods depends on other factors such as where local bus or train lines run to and from and how easy it is to transfer between lines. Although a number of nodes are transit accessible, only 10% of all Bay Area workers take transit to work.
Transit Access to Jobs
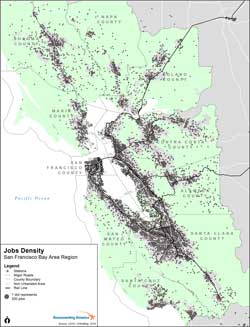
Figure 2: The location of jobs throughout the region
Figure 2 shows that jobs are located throughout the Bay Area, but are clustered in several centers, and primarily located in the inner core of the Bay Area: Oakland to San Jose to San Francisco. Since home prices have pushed lower income residents to outlying communities, many Bay Area residents have long commutes. Low-income residents in outlying communities such as Antioch or Livermore are more limited in the jobs they can access without owning a car.
According to our analysis of areas with frequent transit, 51% of all jobs in the region are located within a half mile of a train or a quarter mile of a public bus running every 15 minutes or more frequently. This excludes private employee shuttles offering service to a single company. However, the ability of residents to take transit to work depends on transit availability at both their home and work, the ability to easily transfer between lines, the frequency of transit, travel time, and cost.
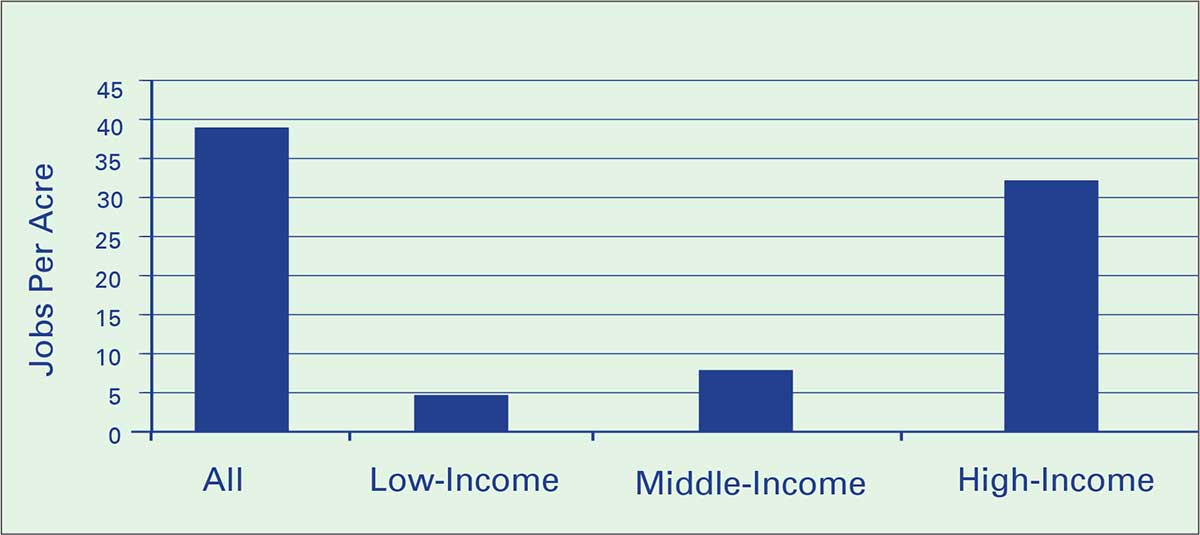
Figure 3: Average Weighted Employment Density by Income

Source: U.S. Census Longitudinal Employer Dynamics, 2010.
While some of the region’s most concentrated job centers – downtown San Francisco, downtown Oakland, and parts of Santa Clara County – offer a diversity of jobs at all skill and wage levels, an analysis of average job density shows that there is a marked contrast between the concentration of low-wage jobs and of middle- or high-wage jobs throughout the region. Figure 3 shows that the average weighted density of high-wage jobs (paying more than $40,000 annually) is about 32 jobs per acre, compared with low-wage jobs (paying $15,000 or less annually), which average about 4.7 jobs per acre.
On average across the region, high-wage jobs are more than six times as dense as low-wage jobs.
Job density affects the ability of transit to serve job centers. High-density job centers are key priorities for transit service as they have the potential to generate significantly more transit riders, and are thus more efficient to serve. For low-income workers who cannot afford to drive, the fact that low-wage jobs are in lower density places, on average, means that walking, biking and transit infrastructure will all be important commuting elements as many low-income workers will likely use a combination of all the above for their daily work commute.
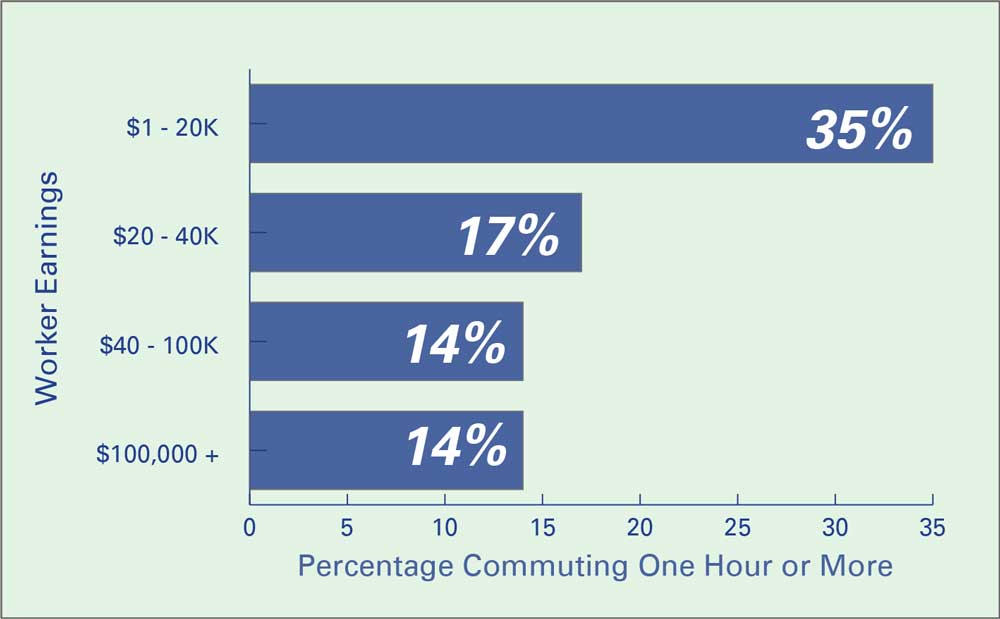
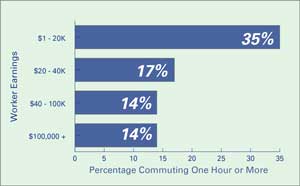
Figure 4: Bay Area Commute Time by Income
Source: PUMS, American Community Survey 2006-2010
Commute times and the cost of transportation place heavy burdens on low-income workers. This is particularly true for the lowest-income workers in the Bay Area. Figure 4 shows, for example, that workers earning less than $20,000 per year are twice as likely to have commutes that take an hour or longer each way. More than a third of low-income workers have commutes longer than an hour.
The majority of workers at all wage levels drive to work in the Bay Area. However, workers in the lowest income category are more likely to walk or take transit to their jobs than the average Bay Area commuter. About 17% of workers making less than $20,000 a year take transit or walk, compared to 13% of all workers in the region.
If you’re taking a straight shot to the City via transit, it’s easy. But if you’re going home or somewhere else, it’s a lot different. South Alameda County is a lot different than Oakland. If you’re not right on the two BART stations, then you’re not getting around faster than a car.
-Congregations Organizing for Renewal
It is also important to note that the difference in commute patterns (commute time and mode) of low-income workers and moderate-income workers is more significant than the difference between those of moderate-income workers and high-income workers. This underscores the greater need for transit service among the lowest-paid workers in the region, who are more transit-dependent than higher earning workers, and that transit service can potentially have a more substantial impact on the economic opportunities for low-income workers than on those of moderate-income workers, who typically have more transportation options.
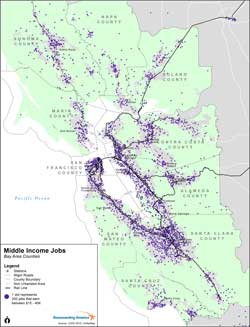
Figure 5: Middle-Income Job Concentrations in the Bay Area
Brief One outlined a number of potential strategies for increasing economic opportunities for low-income workers. One of these strategies is to increase access to career-ladder jobs. This study evaluated career-ladder jobs in a number of ways. This section describes the location of all jobs requiring more than a high school degree but less than a bachelor’s degree, or “middle-skill jobs.” Brief Three offers more detail on specific industries with concentrations of career-ladder jobs using a definition that incorporates job stability, upward mobility and pay, in addition to educational attainment.
Figure 5 shows the location of middle-skill jobs throughout the region. About 50% of middle-skill jobs are located near frequent transit. Many are concentrated in the region’s main job centers: downtown San Francisco, downtown Oakland, downtown San Jose, Pleasanton, Walnut Creek, etc. These centers employ workers with some formal training or on-the-job experience, such as administrative staff, and are therefore economically diverse. But the region’s job centers differ in the types of jobs they offer, both in terms of skill set and pay. The “Case Studies” section later in this brief compares and contrasts several of the region’s job centers.
While many job centers are near transit, the ability of workers to take transit to work varies greatly depending on the location of the job center. A number of factors determine whether a job is truly “transit-oriented” for an employee, including the proximity of transit to a job center, the hours transit is available, and the hours worked.
Night students don’t even have the choice to take transit. Our night classes start at 8 p.m., but our local bus service ends before then.
–Kathy Farwell, Mart inez Adult Education
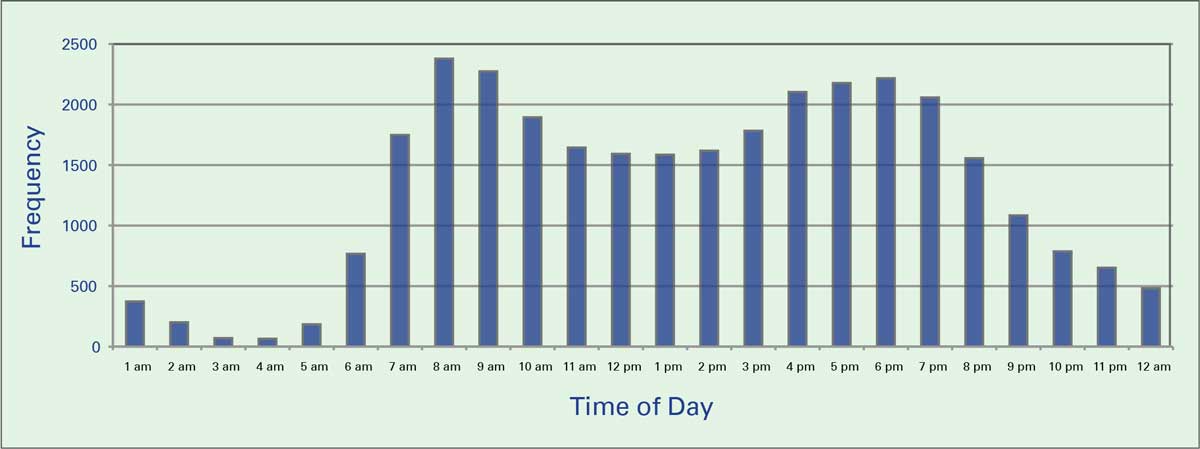
The region’s transit network has been designed to expand capacity at peak hours, and reduce capacity at other hours. This system is generally efficient and lowers transit operating costs, which is critical because most transit agencies face significant operating deficits. Transit service favors a daily 8 a.m. to 5 p.m. commute, when local bus and regional rail service are at their peak frequencies. Figure 6 shows the regionwide number of trains and buses operating within each hour of the day.
Figure 6: Transit Frequency Over 24 Hours
Source: MTC and Reconnecting America.
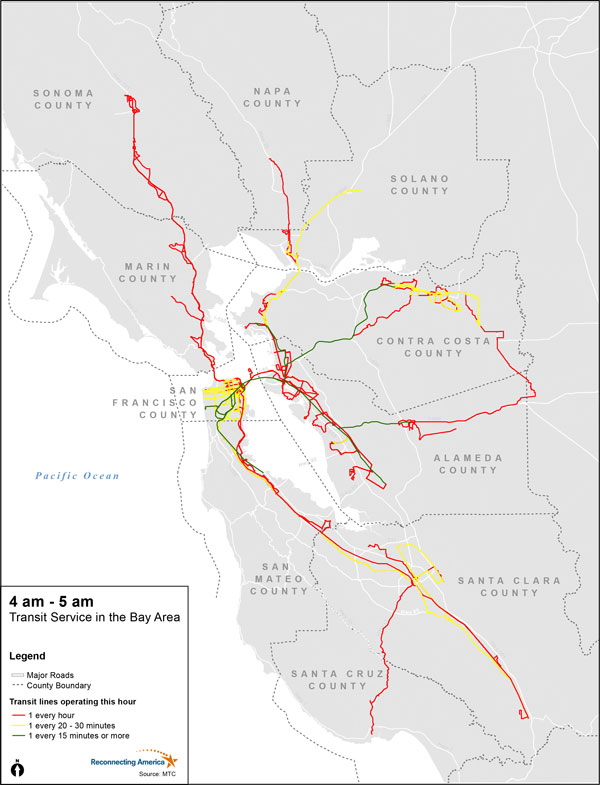
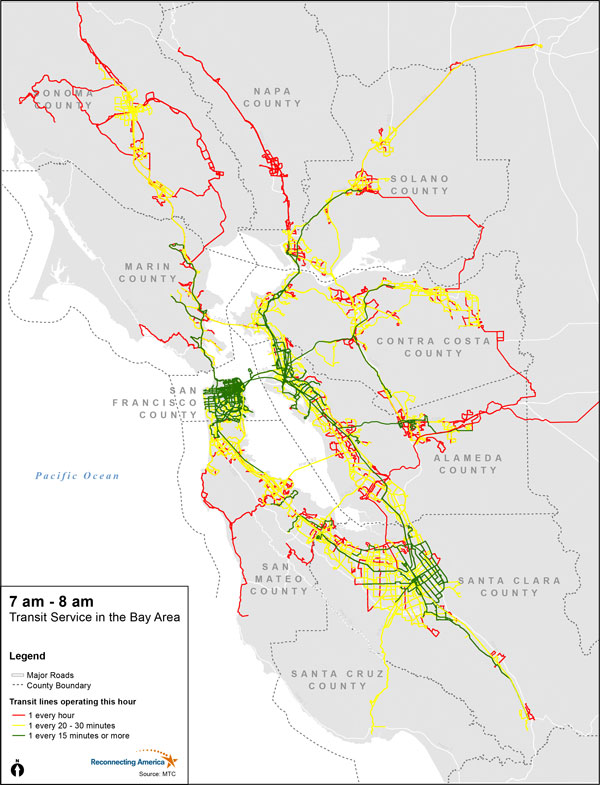
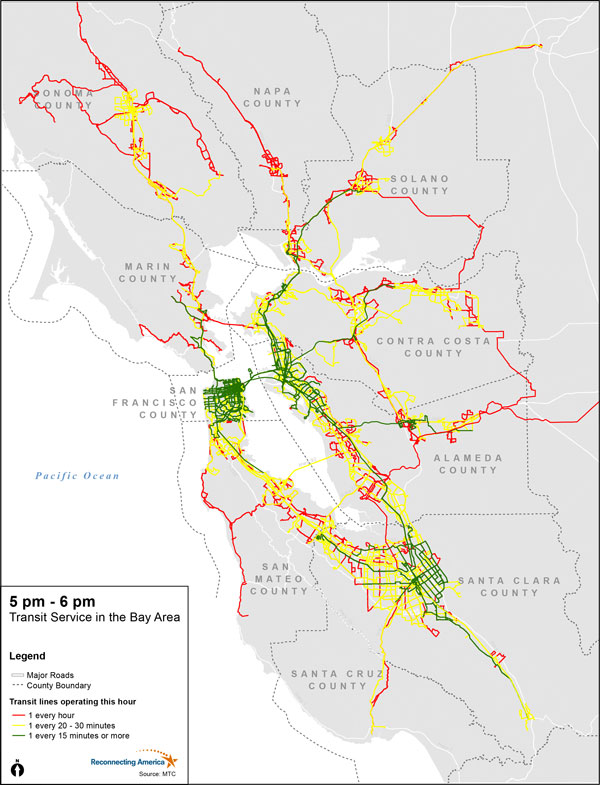
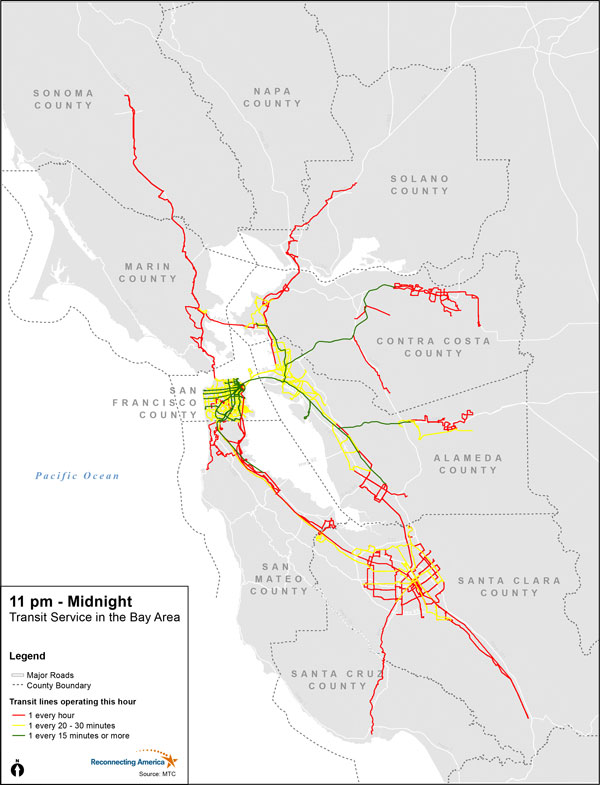
However, for commuters who travel before or after peak hours – such as construction workers, community college students, retail and restaurant employees, and nurses and other hospital works – transit service can be sparse. Often, trips must be made in the dark, which can feel unsafe.
Figure 7 compares a morning commute for workers starting a 5 a.m. shift versus an 8 a.m. shift, and Figure 8 compares evening commutes leaving at 5 p.m. versus 11 p.m.
Figure 7: Morning Transit Frequencies Compared: 4 a.m. to 5 a.m. vs. 7 a.m. to 8 a.m. (Click image to view full size)
Figure 8: Evening Transit Frequencies Compared: 5 p.m. to 6 p.m. vs. 11 p.m. to 12 a.m. (Click image to view full size)
Watch animation of 24 hours of Bay Area Transit Service
Job location and shift hours determine worker transportation options and choices while class schedules determine when students need to travel and how they travel. Ultimately, the decision between paying for a car and sitting in traffic or taking a long, expensive transit ride is second to the economic reality of the job market. For jobs at off-peak hours or remote locations, car commuting is often more convenient. However, some low-income workers do not have that option. Whether they use cars or transit, low-income workers often take jobs where the time and financial costs of commuting are high relative to wages earned.
Case Study: Job Centers Vary in Their Composition
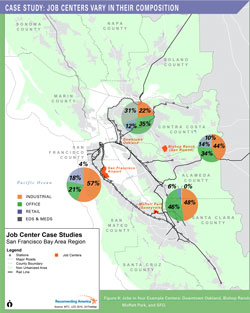
Figure 9: Jobs in four Example Centers: Downtown Oakland, Bishop Ranch, Moffett Park, and SFO.
There are many challenges to connecting low-income workers to jobs via transit. Work shifts do not always align with peak transit service; widely dispersed jobs are difficult to serve with transit; and good transit connections do not always exist between the homes of low-income workers and their jobs.
The following case studies show that job centers vary widely – in the composition of their workforce, in their transit service and bike/pedestrian access, and in the geographic range of their employees’ residences, also known as “commute shed.” To illustrate the significant differences among job centers, this section compares the job composition of four job centers: San Francisco International Airport (SFO), downtown Oakland, Bishop Ranch in San Ramon, and Sunnyvale’s Moffett Park. Figure 9 shows where these job centers are located in the region.
Members looking for work will look for anything, regardless of location or commute, even if the commute leads to LOSING money. People are willing to travel for these jobs because it is middle-skill or higher paying.
-Congregations Organizing for Renewal member
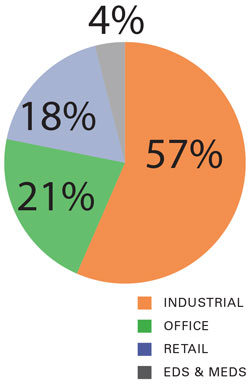
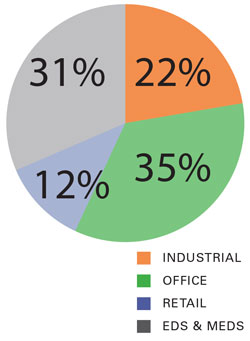
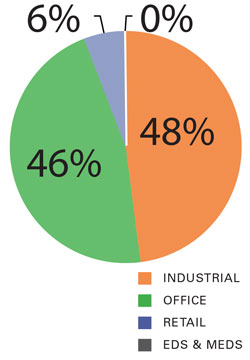
Of the four job centers profiled, three have a smaller percentage of low- and middle-skill workers than the regional average of 57%. In general, concentrated job centers will tend to represent higher-wage workers, since low-income jobs tend to be dispersed rather than located in job centers. However, unlike the other three job centers profiled, San Francisco International Airport and its surrounding district has a workforce that reflects a range of wage levels typical of the region as a whole.
In some job-rich areas, such as Sunnyvale’s Moffett Park and other Silicon Valley job centers, the workforce is primarily high-income and high-skill. More than 90% of jobs in Sunnyvale’s Moffett Park pay more than $40,000 per year, a much higher share of higher-income jobs than in the region overall. Workers commuting to Sunnyvale are concentrated in the surrounding counties: southern Alameda County, Santa Clara County, and San Mateo County. Strategies by policy-makers to connect workers to this type of job center via transit tend to focus on providing attractive alternatives to driving, capturing “choice” commuters, rather than serving lower-income residents.
By contrast, downtown Oakland, with its mix of retail, restaurants, and offices, and the San Francisco International Airport district, with its many transportation and industrial jobs, employ many workers who earn less than $40,000 a year. Both job centers are currently well-connected to the regional transit network. However, because of the 24-hour operation of airport-related facilities, transit serves the SFO district less well than it serves downtown Oakland during “off-peak” shifts. Both of these job centers have commuters traveling from all across the region. Downtown Oakland and the SFO district have more income diversity in their workforce and better transit access than Moffett Park or Bishop Ranch and also attract workers from a much wider area than Sunnyvale or San Ramon alone.
Bishop Ranch has more low-income workers than Sunnyvale, but has fewer transit connections than any of the other job centers studied. Transit serving Bishop Ranch consists of private shuttles to and from Bay Area Rapid Transit (BART) stations and some local bus service. In part because of its location and in part because of the types of jobs offered, workers commuting to this job center tend to come from a more limited geographic area centering on Alameda and Contra Costa Counties. While Bishop Ranch looks more like Sunnyvale in its potential to connect workers to jobs via transit, the employment park operates a successful transportation demand management program that has resulted in 33% of workers taking transit. The owners of Bishop Ranch have bought their own fleet of buses and work with the city and county transit agencies to subsidize bus passes for workers on public bus routes that serve the campus.
San Francisco International Airport’s large workforce broadly reflects the skill and wage levels of Bay Area employment as a whole. The SFO district draws workers from as far away as Sacramento and San Joaquin Counties, showing just how far workers will travel for jobs. Because it operates on a 24-hour basis, the SFO district poses commute challenges that highlight the problems employees face when trying to use transit to access jobs at off-peak hours.
The SFO district employs 34,000 people at diverse businesses at and near the airport. Positions range from management and engineering jobs to food service and custodial jobs. The airport also provides a large number of middle-skill, middle-wage jobs in warehousing and logistics management.
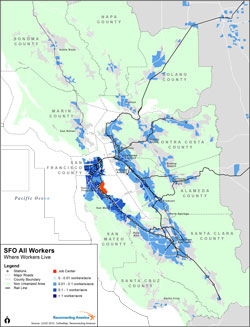
Figure 11: Commuting Pattern to SFO.
About 57% of jobs in the SFO district are classified as low- and middle-skill, about the same percentage as jobs in the Bay Area as a whole. SFO district jobs are also broadly representative of regional wages, with 40% of jobs paying less than $40,000 a year, compared to 48% for the Bay Area region.
The SFO district demonstrates the barriers low-income and shift workers face in getting to their jobs. Although the SFO district is located directly on BART, which connects to the Caltrain line, and is served by SamTrans buses, many employees find it difficult to use transit to get to work. The airport and supporting businesses run on a 24-hour schedule, but transit schedules do not match these needs. BART does not start service until 4:30 a.m. and service ends around midnight. Bus options are sparse, and many bus lines were cut when BART added a direct connection to SFO. Transportation options including cabs, shuttles, and driving/parking are designed and priced for airport passengers, not for workers, and are too expensive for daily commuting.
SFO airport workers have very difficult commutes throughout the Bay Area, especially during “off-peak” hours. For example, in order to take BART to a 5 a.m. shift, a worker from Hayward would have to arrive the night before and sleep at the airport, in order to arrive on time. The cost of BART is also high, at nearly $20 round-trip. If the worker wanted to take a bus instead, she would have to spend four hours in transit and make three transfers.
Not only are the limited hours of transit a problem, many low-income workers lack a way to get from their homes in neighborhoods with limited transit access to a rail station or regional bus stop to start their journey to work, especially during “off-peak” hours.
Since housing costs in San Mateo County are relatively high compared to other areas in the region, many SFO district workers cannot afford to live near the airport. Only 43% of airport workers live within 10 miles of their workplace. Along the BART and Caltrain lines leading to the airport, there is relatively little housing affordable to the majority of workers at the airport. The housing and transit available near the airport district do not match the needs of its workforce. The high monetary, time, and stress costs of commuting affect both productivity and the health and quality of life for workers and their families.
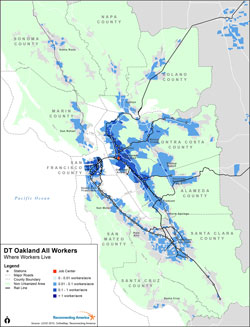
Where workers in Download Oakland live.
Downtown Oakland represents a high-density, urban employment center with a range of housing prices nearby and good transit connections. It has a mix of office, retail, and restaurant jobs, and like the SFO district, is located on major rail and bus lines. Like the SFO district, it has a large supply of low- and middle-skill jobs and about 34% of workers make less than $40,000. However, with a smaller percentage of shift work and more affordable housing nearby, it is more accessible to a variety of employees.
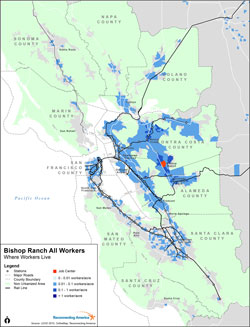
Where workers at Bishop Ranch live.
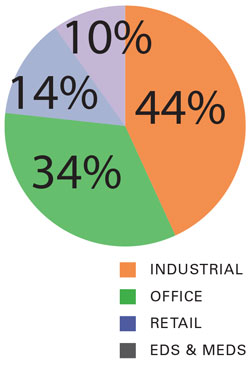
Twenty miles southeast of downtown Oakland, Bishop Ranch in San Ramon represents a moderate density suburban employment center with no direct rail connection, but with good bus connections to rail stops. This large office park, which is owned by a single entity and leases offices to scores of tenants, reports having achieved 33% transit ridership from 30,000 employees, through coordination with public transit agencies and its own private bus shuttle service. The owners of Bishop Ranch actively promote their transportation services to both employees and corporate tenants, and use transit incentives including free public bus passes for all tenants to market their leasable space. While Bishop Ranch has a substantial proportion of workers earning less than $40,000—29% of all employees—the fact that most of its employees work standard office hours makes it easier to meet their transit needs. For low-income workers, since the “last-mile” connections to Bishop Ranch are relatively frequent, the biggest challenge to getting to work may be the segment from home to BART or a bus – the “first-mile” connections.
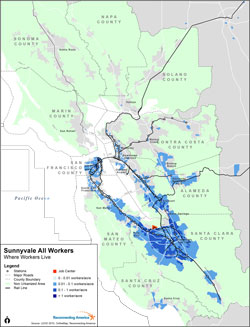
Where workers at Moffett Park live.
In Sunnyvale, Moffett Park is a moderate-density district of light industrial, office, and research and development facilities with somewhat limited transit service typical of many employment centers in Silicon Valley. Moffett Park is served by a Santa Clara Valley Transportation Authority (VTA) light rail station and several bus lines. Of the four employment centers studied here, Moffett Park has the highest worker incomes and education levels (only 7% of workers earn less than $40,000 a year).
The higher pay scale at Moffett Park may allow more employees to live within a short drive or transit commute – 54% of workers live within 10 miles – compared to the other employment centers dominated by lower-wage jobs.
The Last and First Mile of a Work Commute
The Missing Link
While the Bay Area has an extensive rail system including BART, Caltrain, MUNI, Altamont Commuter Express, Capitol Corridor, and VTA, the “first-mile” from home to rail or “last-mile” from rail to work is a hard gap to bridge for many low-income workers.
Many employment centers look close to a transit stop on a regional map. On the ground, however, the distance and hazards between a rail station and a work site are often a problem. Many sprawling industrial parks such as Moffett Park were originally designed without sidewalks, so the walk from transit to jobs can be dangerous as well as long. Even short distances between bus or rail stops and retail centers and industrial zones can be hazardous if they pass through dark or isolated areas under freeways or across major arterials.
Bicycles can be a convenient way to get from home or work to rail or bus connections, but BART restricts bicycles at rush hour, and not all buses have bike racks. Lack of lighting, bicycle lanes, and secure parking can also make bicycling dangerous.
Public Shuttles
Public shuttles provide an important connection between rail lines and employment centers. Some examples of public shuttles include:
| Shuttle System |
Location |
Connections |
Funder(s) |
| Caltrain |
San Mateo, Santa Clara Counties |
Caltrain Stations to employment centers |
Bay Area Air Quality Management District, Peninsula Corridor Joint Powers Board, San Mateo County Transportation Authority, participating employers |
| Emery-Go-Round |
Emeryville |
MacArthur BART to Emeryville businesses |
Emeryville businesses |
| The B on Broadway |
Downtown Oakland |
Downtown Oakland BART stations to Jack London Square and Lake Merritt |
Bay Area Air Quality Management District |
Private Shuttles
Proprietary shuttles operated by Silicon Valley employers – including Google, Facebook, Apple and eBay – connect the corporate campuses directly to residential areas, especially in San Francisco neighborhoods, bridging both the first and last mile. However, shuttles are typically only available and free to ride for full-time and permanent employees and many lower-skill jobs on these campuses are contract positions.
Next, Brief Three focuses on how key industries with career-ladder jobs are connected to the transit network. It looks specifically at six key sectors, or “industries of opportunity” that are the emphasis of workforce training and economic development programs, many of which offer potential career ladder positions. Brief Four sets out the full set of recommendations based on the research from this study.

 Download a PDF copy of this brief


