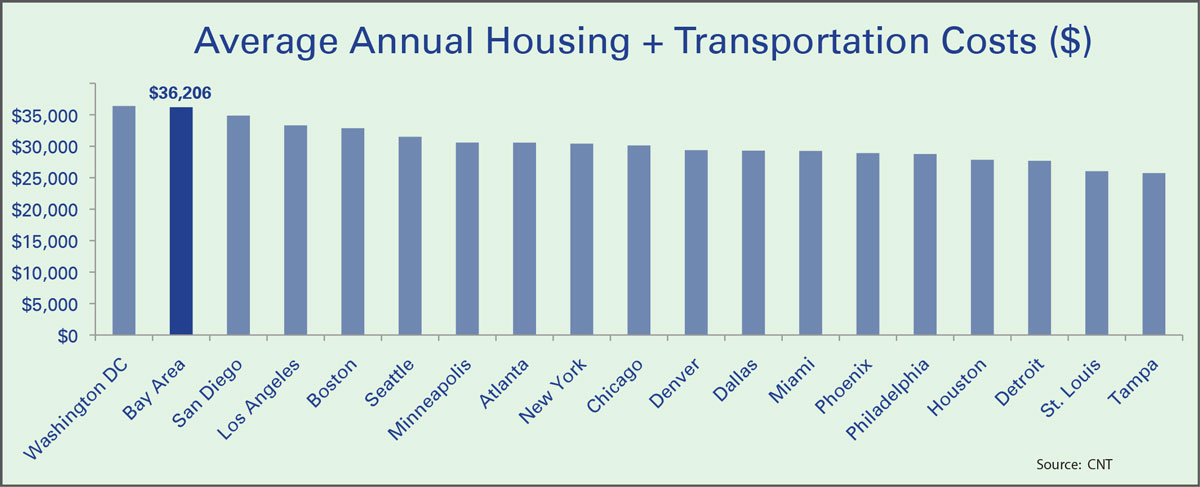
Figure 2 shows that the Bay Area has the highest combined annual average housing and transportation cost in the nation. Together, transportation and housing costs for all income levels averages $36,206 per household in the Bay Area, on par with Washington, D.C., and 19% higher than the New York City region. The average household in the Bay Area spends $13,350 in transportation costs annually. However, neighborhoods offering more transportation options, shorter commutes, and services and shopping within walking or biking distance have significantly lower transportation costs. These areas are generally in the region’s most dense urban centers, ringing the Bay, and at major transportation nodes.
Figure 2. The Bay Area Has One of the Highest Combined Housing and Transportation Costs
Click to view larger image
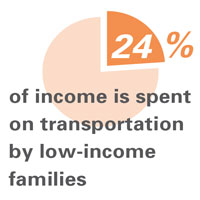
The average low-income Bay Area household spends around 24% of its income on transportation, compared with the U.S. average of 18%. The cost of owning a car comprises the largest share of this annual transportation cost, averaging an estimated $6,500 for a small car. Low-income households in the Bay Area are five times more likely not to own a car compared to higher income households. When those families live in neighborhoods well-connected by transit to employment centers, this may be a choice they make to save money. However, the fact that 84% of low-income Bay Area households do own a car indicates that residents in many communities may choose to have a car, despite the costs. Low-income households that do own a car may not be able to afford to drive it regularly, or may cut other essential expenses in order to pay for vehicle costs. The size of the region and sprawling location of many jobs makes transit dependence highly challenging. Brief Two in this series explores these geographic disconnects in greater detail.
Members looking for work will look for anything, regardless of location or commute even if the commute leads to LOSING money. People are willing to travel for these jobs if they are middle-skill or higher paying.
–Congregations Organizing
for Renewal member
As households add trips to drop kids off at school, to access services, take classes, or hold down multiple jobs – transportation costs increase and transit becomes even less viable as a means to get around. The commute trip only comprises one in every five trips the average person makes, meaning those other trips quickly contribute to the expense of transportation.
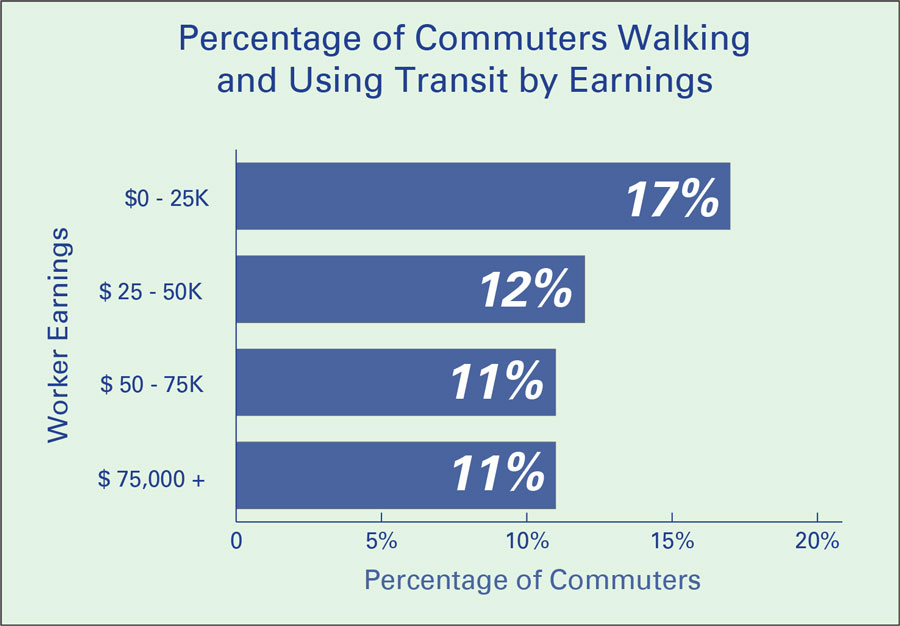
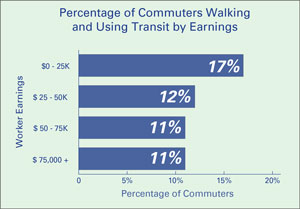
Figure 3. Low-Income Workers are More Likely to Use Transit or Walk to Work
Click to view larger image
Figure 3 shows that low-income workers are more likely than other workers to take transit or walk to work. Nearly 18% of workers earning less than $25,000 a year walk or take transit, compared with 10% to 12% of workers in higher income categories.
The cost of transit can be a heavy burden for low-income, transit-dependent households, although monthly passes can sometimes help reduce costs. With or without passes, individuals often pay multiple fares for a single trip as they make transfers among lines or change modes or transit agencies.
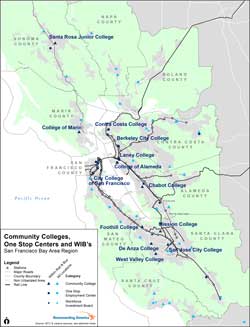
Low-income, transit-dependent workers face many other access and mobility challenges, such as frequency of service, hours of transit operation, and location of homes, work, and services. These are discussed in Brief Two.

 Download a PDF copy of this brief